With the growing emphasis on environmental, social, and governance (ESG) reporting[1] in the private and public sectors, companies are under increasing pressure to accurately track and report their greenhouse gas (GHG) emissions. Evaluation of GHG emissions on a business-per-business basis (sometimes called activity-based monitoring or bottom-up monitoring[2]) often involves reviewing documents detailing specifics of onsite operations and equipment, energy use and source, and movement of materials and products to and from a facility. While this method works well for individual entities, difficulties arise when we start to think about country-scale emission contributions. The Paris Agreement, adopted at the UN Climate Change Conference (COP21) in 2015, requires country-level action on climate change to limit global warming to 1.5°C[3]. On this country-per-country basis, how can we know who is keeping up their end of the bargain? Advances in satellite technology and geographic information systems (GIS) will continue to make monitoring and reporting on emissions on larger scales more accessible and more cost-effective.
Satellites as a tool to measure global emissions
Satellites offer a unique perspective on the environment, providing a bird's eye view of emissions across large areas. By using remote sensing techniques, satellites can detect and measure air pollution, GHG and other emissions from industrial and natural sources. But how do we visualize this massive amount of data collected often over many years? Enter GIS! Satellite data can be overwhelming and challenging to build conclusions with on its own. Without a visual component, viewers would be scrolling through endless sheets of raw data, and there would be little impact from an important dataset such as this. GIS allows users to process and analyze satellite imagery to identify and measure emissions and provides an opportunity to overlay emissions data with other environmental and demographic information (e.g., land use, population density, land use) to create detailed maps and visualizations which help identify emission sources and evaluate their impact on surrounding communities. This information is critical in helping policymakers and companies make informed decisions about where to target emission reduction efforts and can bring accountability and help make the results of emission reduction efforts more transparent.
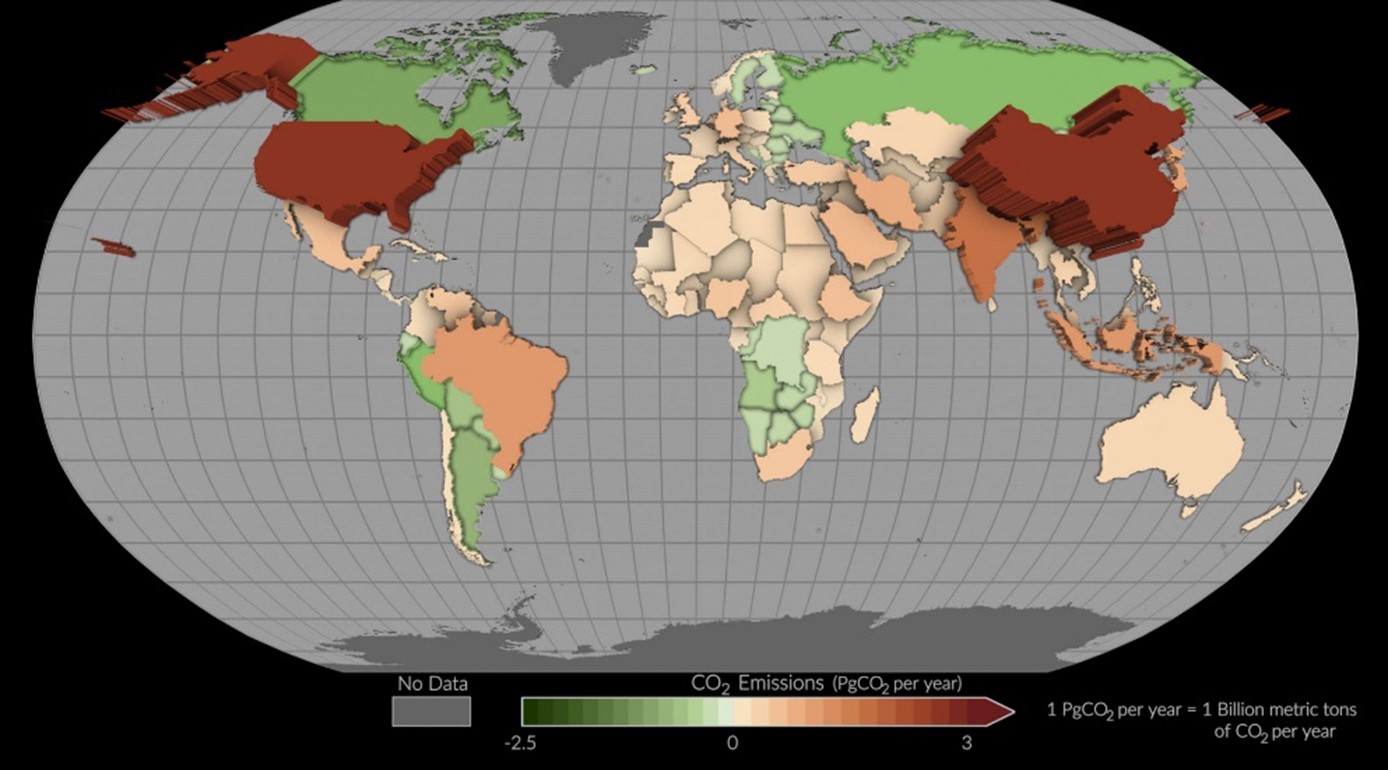 Figure 1: Satellite data, coupled with geographic information systems (GIS), can be used to create detailed maps and reports that provide valuable insights into the impact of emissions on the environment and human health. In 2015, NASA deployed the Orbiting Carbon Observatory-2, which was equipped with instruments that allowed scientists to observe greenhouse gas emissions from 2015 to 2020. One of the uses of this highly detailed dataset was to break emissions up into geographic regions to illustrate better the ‘big players’ on a country level for emission contribution. In the image above, we see CO2 emissions from around the world from 2015 to 2020 – all based on satellite data.2
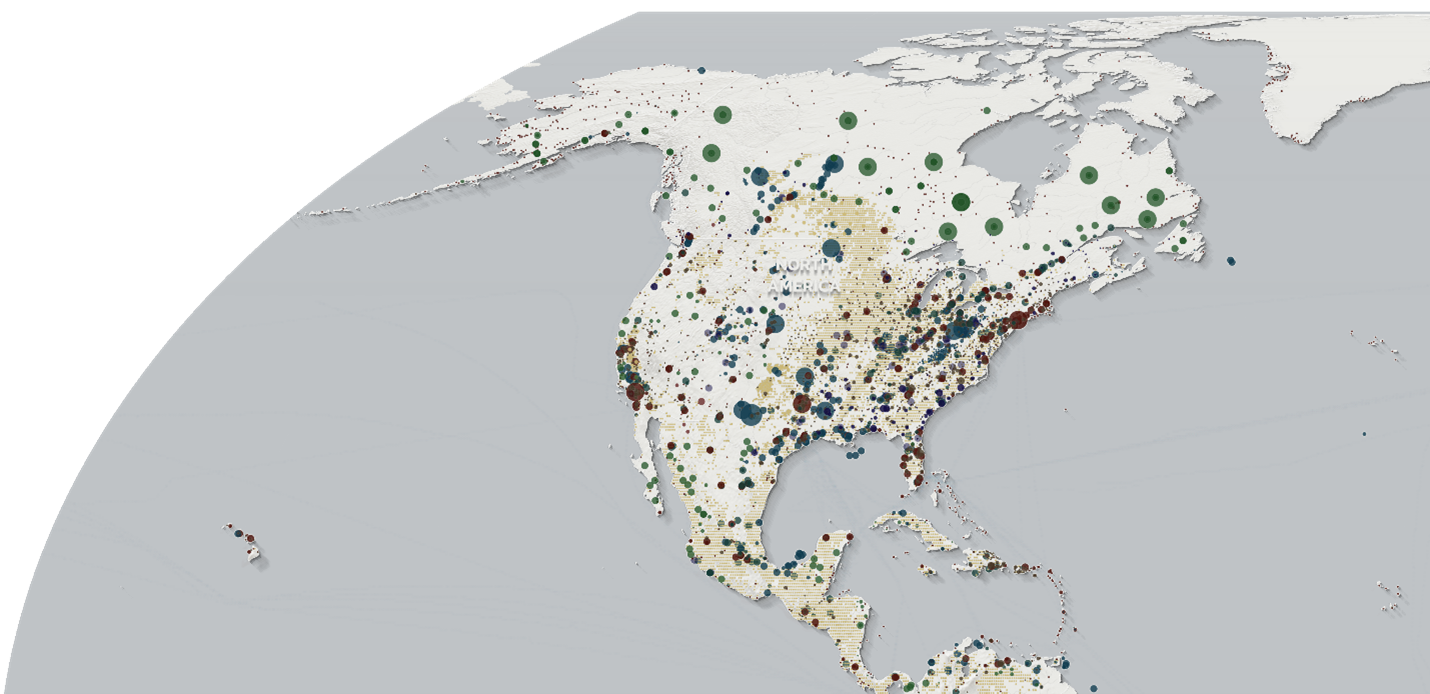 Figure 2: Climate Trace, a non-profit aimed at taking emissions data collected via satellite and creating impactful visuals, was funded with a Google grant to process satellite data and track emissions from space[4]. Their interactive geospatial map utilizes satellite data collected from several public and private satellites in orbit and allows users to explore carbon emissions on the sub-country level. Within Climate Trace’s interactive website, users can toggle to a region of interest and see carbon emission contributions broken down by assets (e.g., agricultural, manufacturing, oil and gas).
The downsides to a top-down approach
While we have explored the benefits of monitoring and reporting emissions with satellites on a country scale, it is far from replacing the bottom-up approach to collecting emissions data on a facility-level scale. Without a bottom-up approach to verify on-site emissions, how would satellite data separate the emissions from two neighboring facilities? In the environmental remediation practice at BBJ, we occasionally work with groundwater that has plumes within plumes of contamination. We must do the tedious work of separating out the ’who done it’ with complicated geochemical analysis[5].
Can we utilize a top-down approach, such as using satellite data, to make similar, vital, but subtle distinctions of mixed greenhouse gas emission plumes between neighboring facilities? For now, the answer is satellite data alone cannot be accurately relied on for facility-scale greenhouse gas emission reporting. However, there are effective bottom-up methods to calculate and report emissions on the facility scale accurately. BBJ Group ESG Practice
Summary
Overall, GIS and satellite imagery are robust data that together can allow users to identify patterns and trends, evaluate the effectiveness of emissions reduction efforts, and help political figures make informed decisions about environmental policy and sustainability efforts. As technology evolves, we can expect GIS-based emissions tracking to become increasingly important in the large-scale environmental monitoring and reporting landscape.
Though the best, most accurate approach to emissions calculating and reporting remains as a bottom-up approach, perhaps one day, as technology evolves, you will see BBJ Group offer ESG reporting with satellite data!
Sources
[1] Is Voluntary ESG Reporting Still Optional
[2] NASA Space Mission Takes Stock of Carbon Dioxide: Emissions by Countries
[3] UNFCCC: The Paris Agreement
[5] New Commingled Plume Technical Guidance Document Released

.jpg)